You can use a Payment Summary to review the guarantor and insurance payments applied during a date range in a numerical and a graphical format. You can preview, print, or send via email previously generated reports at any time after you have generated them.
To run a Payment Summary
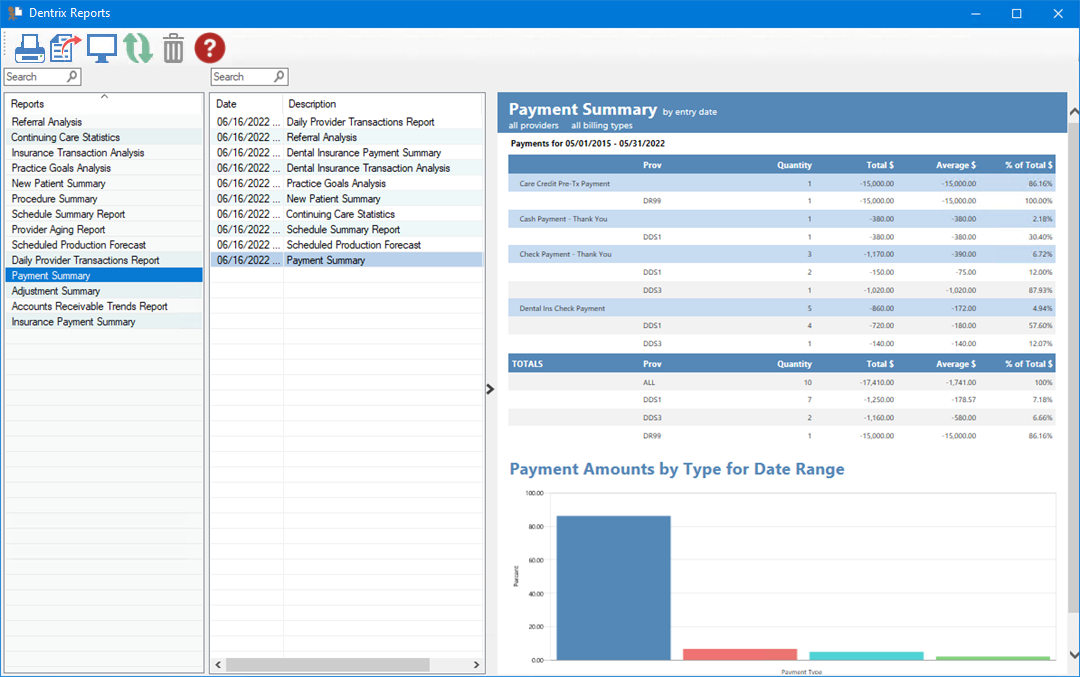
1. In the Office Manager toolbar, click Analysis, and then click Dentrix Reports.
The Dentrix Reports window appears.

2. Under Reports, double-click Payment Summary.
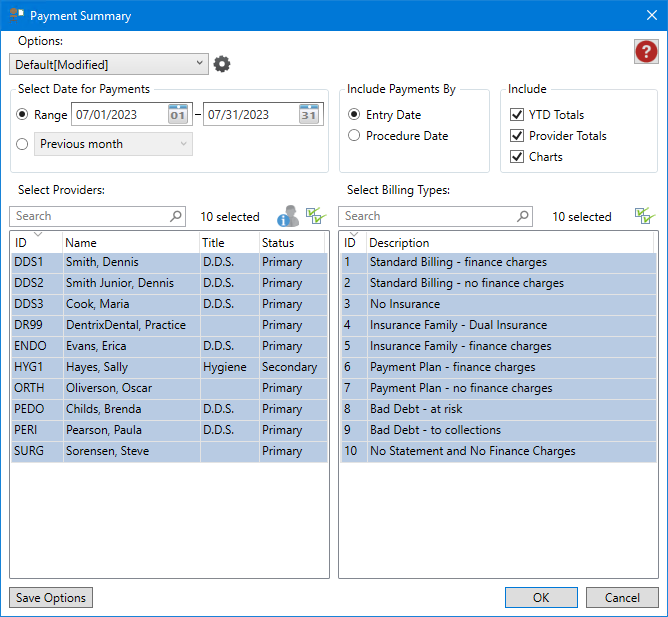
The Payment Summary dialog box appears.
3. To run the report with the default settings, click OK.
The Payment Summary is listed, and a preview of the summary appears.
Note: To view the data, you may need to enlarge the Dentrix Reports window, and go to the end of the report to view any graphs or charts.
4. To modify the default settings in the Payment Summary dialog box, do one or more of the following:
Select Date for Payments – You can set a specific date range or select a set of interval options.
Range – Enter the start and end dates, or click the date icon, and then select the date from the calendar.
Date options – Defaults to the Previous month. For example, if you generate a report on June 2, 2020 using this option, the report will contain data for May 1 through May 31. Other options include:
Current day – Generates a report for the current day.
Previous day – Generates a report for the previous day. For example, if you generate a report on June 2, 2022 using this option, the report will contain data for June 1, 2022.
Previous week – Generates a report for the previous Sunday through Saturday. For example, if you generate a report on Monday, June 6, 2022 using this option, the report will contain data for Sunday, May 29 through Saturday, June 4.
Previous 3 months – Generates a report for the previous 3 months. For example, if you generate a report on June 2, 2020 using this option, the report will contain data for March 1 through May 31.
Previous 6 months – Generates a report for the previous 6 months. For example, if you generate a report on June 2, 2022 using this option, the report will contain data for December 1, 2021 through May 31 , 2022.
Previous fiscal year – Generates a report for the previous year. For example, if you generate a report on June 2, 2022 using this option, the report will contain data for January 1, 2021 through December 31, 2021.
Select Providers – Defaults to all providers. To change the default, click the Select all icon  , and then select the providers that you want to include in the report. Or, type the provider's name in the Search box.
Include Payments By – Sets options to include transactions by entry date or procedure date.
Entry Date – (Default) Select to include all transactions entered into the system today. (To generate the most accurate totals, run the report by Entry Date.)
Procedure Date – Select to include all transactions posted with the derived date of today.
Include – Select one or more of the following options:
YTD Totals – (Default) Select to include year-to-date (YTD) adjustment information.
Provider Totals – (Default) Select to include totals itemized by provider.
Charts – (Default) Select to include charts of the data.
Select Billing Types – Defaults to all billing types. To change the default, click the Select all icon , and then select the billing types that you want to include in the report. Or, type the description of the billing type in the Search text box.
5. To save any changes you made to the default settings, click Save Options.
6. To manage any saved options, click the Manage Saved Options icon  .
.
The Manage Options dialog box appears.
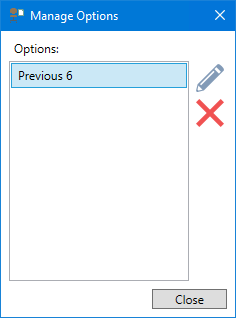
7. Do one of the following:
To rename the option, select it, click the Rename Selected Item icon, and then type a new name.
To delete the option, select it, and then click the Delete Selected Item icon.
Important: You can only rename or delete options that you have created.